LogLogisticFitter

class lifelines.fitters.log_logistic_fitter.LogLogisticFitter(*args, **kwargs)

Bases: lifelines.fitters.KnownModelParametricUnivariateFitter

This class implements a Log-Logistic model for univariate data. The model has parameterized form:

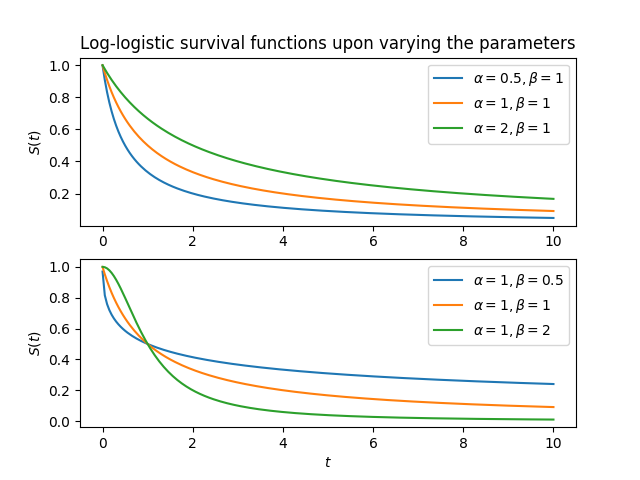
\[S(t) = \left(1 + \left(\frac{t}{\alpha}\right)^{\beta}\right)^{-1}, \alpha > 0, \beta > 0,\]

The \(\alpha\) (scale) parameter has an interpretation as being equal to the median lifetime of the population. The \(\beta\) parameter influences the shape of the hazard. See figure below:

../../_images/log_normal_alpha.png

The hazard rate is:

\[h(t) = \frac{\left(\frac{\beta}{\alpha}\right)\left(\frac{t}{\alpha}\right) ^ {\beta-1}}{\left(1 + \left(\frac{t}{\alpha}\right)^{\beta}\right)}\]

and the cumulative hazard is:

\[H(t) = \log\left(\left(\frac{t}{\alpha}\right) ^ {\beta} + 1\right)\]

After calling the .fit method, you have access to properties like: cumulative_hazard_, plot, survival_function_, alpha_ and beta_. A summary of the fit is available with the method ‘print_summary()’

Parameters:alpha (float, optional (default=0.05)) – the level in the confidence intervals.

Examples

from lifelines import LogLogisticFitter
from lifelines.datasets import load_waltons
waltons = load_waltons()

llf = LogLogisticFitter()
llf.fit(waltons['T'], waltons['E'])
llf.plot()
print(llf.alpha_)
cumulative_hazard_

The estimated cumulative hazard (with custom timeline if provided)

Type:DataFrame
hazard_

The estimated hazard (with custom timeline if provided)

Type:DataFrame
survival_function_

The estimated survival function (with custom timeline if provided)

Type:DataFrame
cumulative_density_

The estimated cumulative density function (with custom timeline if provided)

Type:DataFrame
density_

The estimated density function (PDF) (with custom timeline if provided)

Type:DataFrame
variance_matrix_

The variance matrix of the coefficients

Type:DataFrame
median_survival_time_

The median time to event

Type:float
alpha_

The fitted parameter in the model

Type:float
beta_

The fitted parameter in the model

Type:float
durations

The durations provided

Type:array
event_observed

The event_observed variable provided

Type:array
timeline

The time line to use for plotting and indexing

Type:array
entry

The entry array provided, or None

Type:array or None
AIC_
BIC_
conditional_time_to_event_

Return a DataFrame, with index equal to survival_function_, that estimates the median duration remaining until the death event, given survival up until time t. For example, if an individual exists until age 1, their expected life remaining given they lived to time 1 might be 9 years.

confidence_interval_

The confidence interval of the cumulative hazard. This is an alias for confidence_interval_cumulative_hazard_.

confidence_interval_cumulative_density_

The lower and upper confidence intervals for the cumulative density

confidence_interval_cumulative_hazard_

The confidence interval of the cumulative hazard. This is an alias for confidence_interval_.

confidence_interval_density_

The confidence interval of the hazard.

confidence_interval_hazard_

The confidence interval of the hazard.

confidence_interval_survival_function_

The lower and upper confidence intervals for the survival function

cumulative_density_at_times(times, label: Optional[str] = None) → pandas.core.series.Series

Return a Pandas series of the predicted cumulative density function (1-survival function) at specific times.

Parameters:
  • times (iterable or float) – values to return the survival function at.
  • label (string, optional) – Rename the series returned. Useful for plotting.
cumulative_hazard_at_times(times, label: Optional[str] = None) → pandas.core.series.Series

Return a Pandas series of the predicted cumulative hazard value at specific times.

Parameters:
  • times (iterable or float) – values to return the cumulative hazard at.
  • label (string, optional) – Rename the series returned. Useful for plotting.
density_at_times(times, label=None) → pandas.core.series.Series

Return a Pandas series of the predicted probability density function, dCDF/dt, at specific times.

Parameters:
  • times (iterable or float) – values to return the survival function at.
  • label (string, optional) – Rename the series returned. Useful for plotting.
divide(other) → pandas.core.frame.DataFrame

Divide self’s survival function from another model’s survival function.

Parameters:other (same object as self)
event_table
fit(durations, event_observed=None, timeline=None, label=None, alpha=None, ci_labels=None, show_progress=False, entry=None, weights=None, initial_point=None, fit_options: Optional[dict] = None) → ParametricUnivariateFitter
Parameters:
  • durations (an array, or pd.Series) – length n, duration subject was observed for
  • event_observed (numpy array or pd.Series, optional) – length n, True if the the death was observed, False if the event was lost (right-censored). Defaults all True if event_observed==None
  • timeline (list, optional) – return the estimate at the values in timeline (positively increasing)
  • label (string, optional) – a string to name the column of the estimate.
  • alpha (float, optional) – the alpha value in the confidence intervals. Overrides the initializing alpha for this call to fit only.
  • ci_labels (list, optional) – add custom column names to the generated confidence intervals as a length-2 list: [<lower-bound name>, <upper-bound name>]. Default: <label>_lower_<alpha>
  • show_progress (bool, optional) – since this is an iterative fitting algorithm, switching this to True will display some iteration details.
  • entry (an array, or pd.Series, of length n) – relative time when a subject entered the study. This is useful for left-truncated (not left-censored) observations. If None, all members of the population entered study when they were “born”: time zero.
  • weights (an array, or pd.Series, of length n) – integer weights per observation
  • initial_point ((d,) numpy array, optional) – initialize the starting point of the iterative algorithm. Default is the zero vector.
  • fit_options (dict, optional) – pass kwargs into the underlying minimization algorithm, like tol, etc.
Returns:

self with new properties like cumulative_hazard_, survival_function_

Return type:

self

fit_interval_censoring(lower_bound, upper_bound, event_observed=None, timeline=None, label=None, alpha=None, ci_labels=None, show_progress=False, entry=None, weights=None, initial_point=None, fit_options: Optional[dict] = None) → ParametricUnivariateFitter

Fit the model to an interval censored dataset.

Parameters:
  • lower_bound (an array, or pd.Series) – length n, the start of the period the subject experienced the event in.
  • upper_bound (an array, or pd.Series) – length n, the end of the period the subject experienced the event in. If the value is equal to the corresponding value in lower_bound, then the individual’s event was observed (not censored).
  • event_observed (numpy array or pd.Series, optional) – length n, if left optional, infer from lower_bound and upper_cound (if lower_bound==upper_bound then event observed, if lower_bound < upper_bound, then event censored)
  • timeline (list, optional) – return the estimate at the values in timeline (positively increasing)
  • label (string, optional) – a string to name the column of the estimate.
  • alpha (float, optional) – the alpha value in the confidence intervals. Overrides the initializing alpha for this call to fit only.
  • ci_labels (list, optional) – add custom column names to the generated confidence intervals as a length-2 list: [<lower-bound name>, <upper-bound name>]. Default: <label>_lower_<alpha>
  • show_progress (bool, optional) – since this is an iterative fitting algorithm, switching this to True will display some iteration details.
  • entry (an array, or pd.Series, of length n) – relative time when a subject entered the study. This is useful for left-truncated (not left-censored) observations. If None, all members of the population entered study when they were “born”: time zero.
  • weights (an array, or pd.Series, of length n) – integer weights per observation
  • initial_point ((d,) numpy array, optional) – initialize the starting point of the iterative algorithm. Default is the zero vector.
  • fit_options (dict, optional) – pass kwargs into the underlying minimization algorithm, like tol, etc.
Returns:

self with new properties like cumulative_hazard_, survival_function_

Return type:

self

fit_left_censoring(durations, event_observed=None, timeline=None, label=None, alpha=None, ci_labels=None, show_progress=False, entry=None, weights=None, initial_point=None, fit_options: Optional[dict] = None) → ParametricUnivariateFitter

Fit the model to a left-censored dataset

Parameters:
  • durations (an array, or pd.Series) – length n, duration subject was observed for
  • event_observed (numpy array or pd.Series, optional) – length n, True if the the death was observed, False if the event was lost (right-censored). Defaults all True if event_observed==None
  • timeline (list, optional) – return the estimate at the values in timeline (positively increasing)
  • label (string, optional) – a string to name the column of the estimate.
  • alpha (float, optional) – the alpha value in the confidence intervals. Overrides the initializing alpha for this call to fit only.
  • ci_labels (list, optional) – add custom column names to the generated confidence intervals as a length-2 list: [<lower-bound name>, <upper-bound name>]. Default: <label>_lower_<alpha>
  • show_progress (bool, optional) – since this is an iterative fitting algorithm, switching this to True will display some iteration details.
  • entry (an array, or pd.Series, of length n) – relative time when a subject entered the study. This is useful for left-truncated (not left-censored) observations. If None, all members of the population entered study when they were “born”: time zero.
  • weights (an array, or pd.Series, of length n) – integer weights per observation
  • initial_point ((d,) numpy array, optional) – initialize the starting point of the iterative algorithm. Default is the zero vector.
  • fit_options (dict, optional) – pass kwargs into the underlying minimization algorithm, like tol, etc.
Returns:

Return type:

self with new properties like cumulative_hazard_, survival_function_

fit_right_censoring(*args, **kwargs)

Alias for fit

See also

fit()

hazard_at_times(times, label: Optional[str] = None) → pandas.core.series.Series

Return a Pandas series of the predicted hazard at specific times.

Parameters:
  • times (iterable or float) – values to return the hazard at.
  • label (string, optional) – Rename the series returned. Useful for plotting.
label
median_survival_time_

Return the unique time point, t, such that S(t) = 0.5. This is the “half-life” of the population, and a robust summary statistic for the population, if it exists.

params_
percentile(p)

Return the unique time point, t, such that S(t) = p.

Parameters:p (float)
plot(**kwargs)

Produce a pretty-plot of the estimate.

plot_cumulative_density(**kwargs)
plot_cumulative_hazard(**kwargs)
plot_density(**kwargs)
plot_hazard(**kwargs)
plot_survival_function(**kwargs)
predict(times: Union[Iterable[float], float], interpolate=False) → pandas.core.series.Series

Predict the fitter at certain point in time. Uses a linear interpolation if points in time are not in the index.

Parameters:
  • times (scalar, or array) – a scalar or an array of times to predict the value of {0} at.
  • interpolate (bool, optional (default=False)) – for methods that produce a stepwise solution (Kaplan-Meier, Nelson-Aalen, etc), turning this to True will use an linear interpolation method to provide a more “smooth” answer.
print_summary(decimals=2, style=None, columns=None, **kwargs)

Print summary statistics describing the fit, the coefficients, and the error bounds.

Parameters:
  • decimals (int, optional (default=2)) – specify the number of decimal places to show
  • style (string) – {html, ascii, latex}
  • columns – only display a subset of summary columns. Default all.
  • kwargs – print additional metadata in the output (useful to provide model names, dataset names, etc.) when comparing multiple outputs.
subtract(other) → pandas.core.frame.DataFrame

Subtract self’s survival function from another model’s survival function.

Parameters:other (same object as self)
summary

Summary statistics describing the fit.

See also

print_summary

survival_function_at_times(times, label: Optional[str] = None) → pandas.core.series.Series

Return a Pandas series of the predicted survival value at specific times.

Parameters:
  • times (iterable or float) – values to return the survival function at.
  • label (string, optional) – Rename the series returned. Useful for plotting.