WeibullFitter
- class lifelines.fitters.weibull_fitter.WeibullFitter(*args, **kwargs)
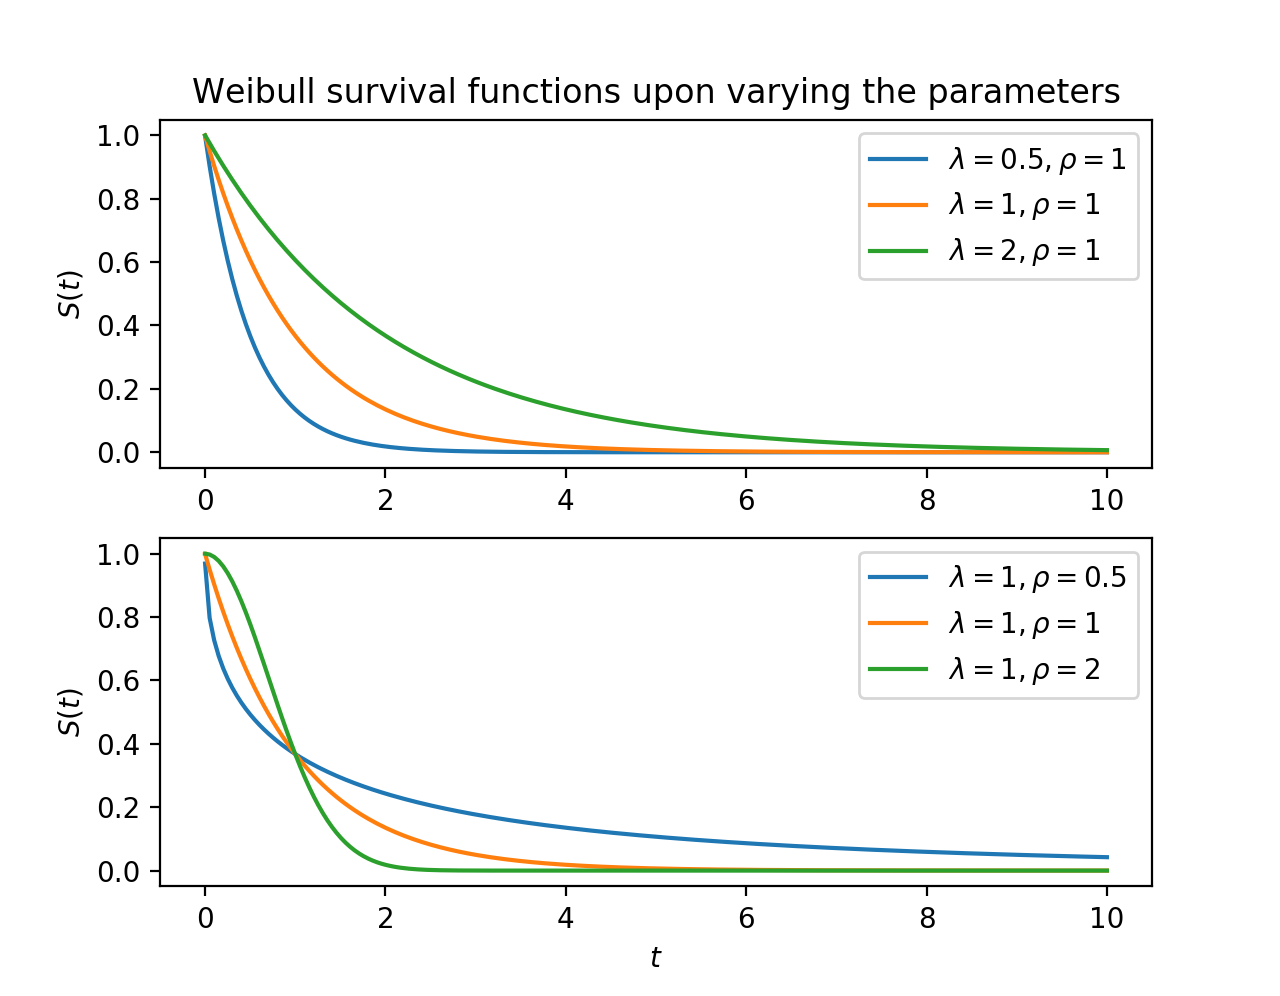
This class implements a Weibull model for univariate data. The model has parameterized form:
\[S(t) = \exp\left(-\left(\frac{t}{\lambda}\right)^\rho\right), \lambda > 0, \rho > 0,\]The \(\lambda\) (scale) parameter has an applicable interpretation: it represents the time when 63.2% of the population has died. The \(\rho\) (shape) parameter controls if the cumulative hazard (see below) is convex or concave, representing accelerating or decelerating hazards.
The cumulative hazard rate is
\[H(t) = \left(\frac{t}{\lambda}\right)^\rho,\]and the hazard rate is:
\[h(t) = \frac{\rho}{\lambda}\left(\frac{t}{\lambda}\right)^{\rho-1}\]After calling the
.fitmethod, you have access to properties like:cumulative_hazard_,survival_function_,lambda_andrho_. A summary of the fit is available with the methodprint_summary().- Parameters:
alpha (float, optional (default=0.05)) – the level in the confidence intervals.
Examples
from lifelines import WeibullFitter
from lifelines.datasets import load_waltons
waltons = load_waltons()
wbf = WeibullFitter()
wbf.fit(waltons['T'], waltons['E'])
wbf.plot()
print(wbf.lambda_)
- cumulative_hazard_
The estimated cumulative hazard (with custom timeline if provided)
- Type:
DataFrame
- hazard_
The estimated hazard (with custom timeline if provided)
- Type:
DataFrame
- survival_function_
The estimated survival function (with custom timeline if provided)
- Type:
DataFrame
- cumulative_density_
The estimated cumulative density function (with custom timeline if provided)
- Type:
DataFrame
- density_
The estimated density function (PDF) (with custom timeline if provided)
- Type:
DataFrame
- variance_matrix_
The variance matrix of the coefficients
- Type:
DataFrame
- median_survival_time_
The median time to event
- Type:
float
- lambda_
The fitted parameter in the model
- Type:
float
- rho_
The fitted parameter in the model
- Type:
float
- durations
The durations provided
- Type:
array
- event_observed
The event_observed variable provided
- Type:
array
- timeline
The time line to use for plotting and indexing
- Type:
array
- entry
The entry array provided, or None
- Type:
array or None
Notes
Looking for a 3-parameter Weibull model? See notes here.
- lambda_: float
- percentile(p) float
Return the unique time point, t, such that S(t) = p.
- Parameters:
p (float)
- rho_: float